
20 Currys Post Road
Howick (uMngeni)
KwaZulu-Natal Midlands
PG Blog
Rob Dempster
Another look at Solar Radiation
Sunshine Duration
and
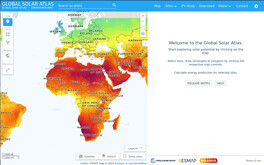
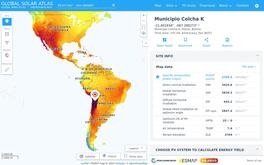
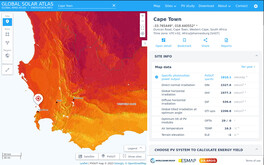
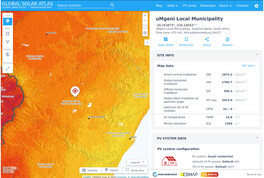
the Global Solar Atlas

|
|
Protea Gardens
20 Currys Post Road Howick (uMngeni) KwaZulu-Natal Midlands PG Blog Rob Dempster Another look at Solar Radiation Sunshine Duration and the Global Solar Atlas |
|
Edith and I spent the first six months of 2000 in Auckland, New Zealand. During January the late warm evenings were superb. Then the days shortened and the clouds became more frequent, and even more frightening, much lower. When the clocks were reset for winter, everyone went inside.
By the time the first semester had come to an end, it was dark, and wet. I could not wait to get back to South Africa and that Big Blue Winter Sky.I was so affected by it all that I then looked at the amount of sunshine one could expect to experience during the course of a year in various places. As can be seen from the table included below, Durban is not a sunny place, Cape Town is. More recently we installed a Solar Panel Electricity Generation System (SPEGS) to 1) increase our depends on the National Supplier Eskom, 2) eliminate the current Load Shedding plague, and 3) to possibly save some money. Now that it is up and running, we are of course interested in how effective the system is, and Edith is doing a good job monitoring the system.
When one purchases a home in the Southern Hemisphere, you want it to be North Facing in the hope that it will be a warm home during the winter. To this end I did look at the traversal of the sun during the Solar Equinoxes to get an impression of what we would experience in terms of exposure to the sun at the heights of Winter and Summer. There is a link in this regard below.
Now that the SPEGS installation has been completed I have become interested in determining the average amount of Solar Energy our home receives on a daily basis throughout the year. The four Global Solar Atlas images represent that interest, and are probably worth looking at. The Global Solar Atlas for which there is a link below, is fairly helpful in this respect.
I have been running a Weather Station since I retired and have posted Rainfall Records from several weather stations from Pietermaritzburg and Howick on the WWW during that time. I am now hoping to get radiation records from one of these Weather Stations in order to process in order to see if they reflect what the Global Solar Atlas does.
| City | Jan | Feb | Mar | Apr | May | Jun | Jul | Aug | Sep | Oct | Nov | Dec | Year |
|---|---|---|---|---|---|---|---|---|---|---|---|---|---|
| Pretoria | 261.0 | 235.0 | 254.0 | 246.6 | 283.0 | 271.0 | 289.0 | 296.0 | 284.0 | 275.0 | 254.0 | 272.0 | 3,220.0 |
| Cape Town | 337.9 | 297.4 | 292.9 | 233.5 | 205.3 | 175.4 | 193.1 | 212.1 | 224.7 | 277.7 | 309.8 | 334.2 | 3,094.0 |
| Johannesburg | 250.1 | 224.8 | 238.8 | 236.9 | 276.0 | 266.9 | 283.9 | 284.1 | 280.8 | 269.5 | 248.7 | 263.9 | 3,124.4 |
| Bloemfontein | 296.3 | 247.9 | 258.6 | 250.2 | 266.0 | 249.9 | 272.6 | 285.9 | 278.0 | 290.9 | 296.5 | 319.5 | 3,312.3 |
| Upington | 352.9 | 298.7 | 297.5 | 283.5 | 290.5 | 270.3 | 289.8 | 307.3 | 300.2 | 328.9 | 345.2 | 367.0 | 3,731.8 |
| Durban | 184.0 | 178.8 | 201.6 | 206.4 | 223.6 | 224.9 | 230.4 | 217.0 | 173.3 | 169.4 | 166.1 | 189.9 | 2,365.4 |
 GSA_Africa.jpg *
|
 GSA_Bolivia.jpg *
|
 GSA_CapeTown.jpg *
|
 GSA_Howick.jpg *
|
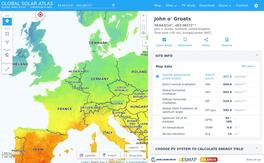 GSA_JohnOGroats.jpg *
|
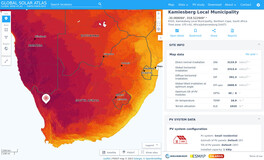 GSA_Kamiesberg.jpg *
|
If you have any comments, corrections, suggestions or plain criticism, I would appreciate it if you would communicate the same to me.
|
|
|
| [email protected] | www.robdempster.com | |

|

|